How to Read a Square Root Curve Chart Effectively
Mathematics is full of interesting concepts, and one of them is the square root curve. A square root curve chart helps us understand how numbers change when we take their square root. Learning how to read this chart can make solving math problems easier. In this article, we will explain the square root curve chart in a simple way so that any student can understand and use it effectively.
What is a Square Root Curve?
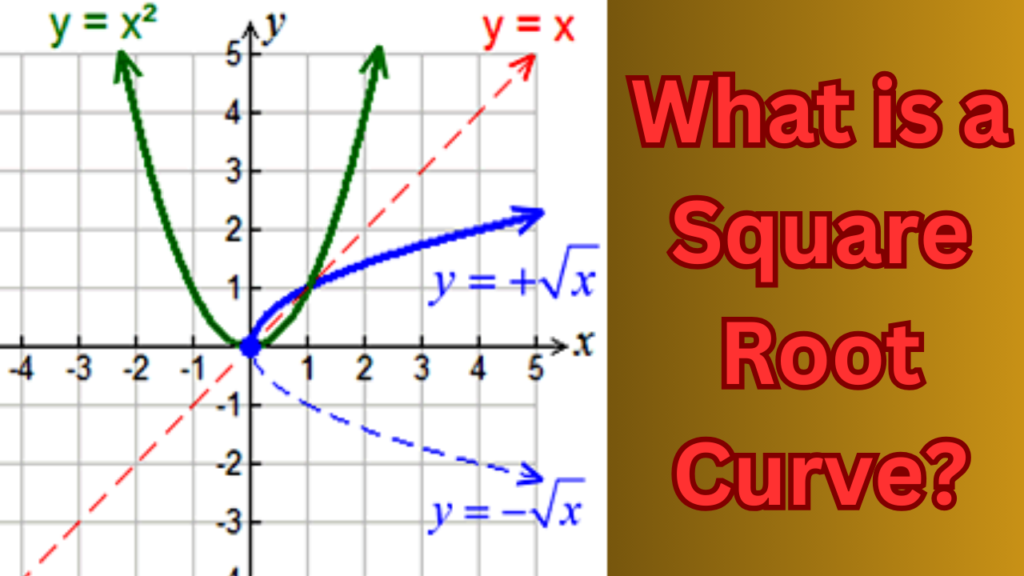
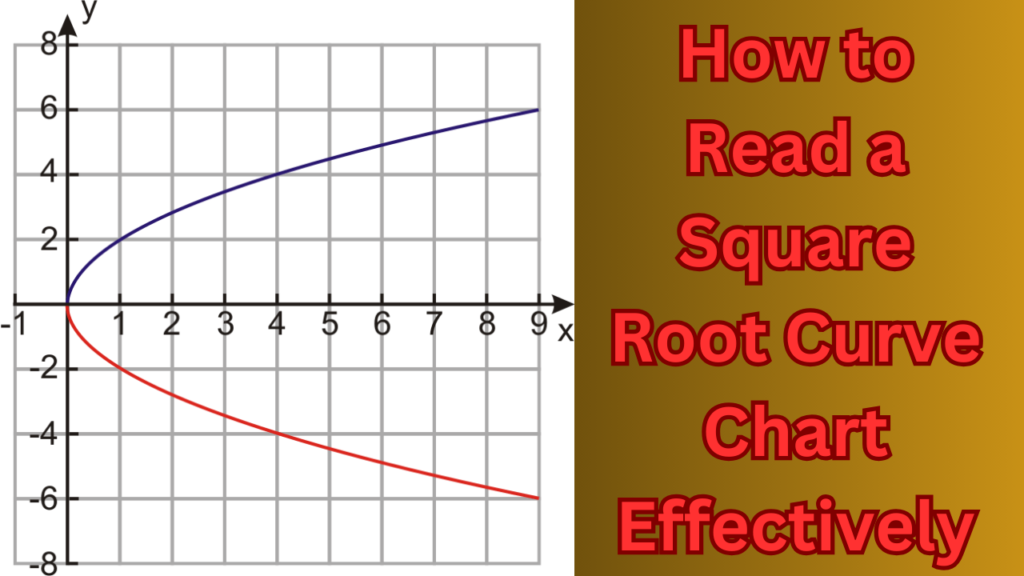
A square root curve is a type of graph that shows the relationship between a number and its square root. The curve represents a function that grows slowly compared to a straight line. This means that as the number increases, its square root also increases but at a slower rate.
For example:
- The square root of 1 is 1.
- The square root of 4 is 2.
- The square root of 9 is 3.
- The square root of 16 is 4.
- The square root of 25 is 5.
If we plot these points on a graph, we get a curved line that starts from the bottom left and slowly rises towards the right. This is known as the square root curve.
Also Check: Who is Daniel Neeleman and Why is He Important?
Parts of a Square Root Curve Chart
To read a square root curve chart, we need to understand its different parts:
X-Axis (Horizontal Line)
- The x-axis represents the numbers we want to find the square root of.
- These numbers start from 0 and increase to larger values.
Y-Axis (Vertical Line)
- The y-axis represents the square root values of the numbers on the x-axis.
- These values are smaller than the x-values but still increase as x increases.
The Curve
- The curve represents the relationship between x and its square root.
- It starts from the bottom left and moves upward slowly.
Grid Lines
- Grid lines help us locate points easily on the chart.
- They make reading values more accurate.
How to Read a Square Root Curve Chart
To read a square root curve chart, follow these steps:
Identify the Number on the X-Axis
First, find the number for which you want to determine the square root. Look along the x-axis until you reach this number.
Find the Corresponding Point on the Curve
Move your finger or a pencil upward from the number on the x-axis until it touches the curve. This is the point that represents the square root of the number.
Locate the Square Root on the Y-Axis
Now, move to the y-axis from the point where your finger or pencil touched the curve. The number on the y-axis is the square root of the original number.
For example:
- If you want to find the square root of 9, locate 9 on the x-axis.
- Move up until you hit the curve.
- Move left to the y-axis to find the value. It should be 3.
This method helps you quickly find square roots without using a calculator.
Why is the Square Root Curve Important?
The square root curve is important in many real-life applications. Here are some reasons why:
Helps in Understanding Math Concepts
- It visually shows how square roots work.
- Students can see how numbers grow at different rates.
Used in Science and Engineering
- Square roots are used in physics, engineering, and data analysis.
- Scientists use these charts to calculate speed, force, and energy in different formulas.
Useful in Everyday Life
- Architects and builders use square roots to design structures.
- Computer scientists use them in programming and data calculations.
Tips for Reading a Square Root Curve Chart
To improve your ability to read a square root curve chart, keep these tips in mind:
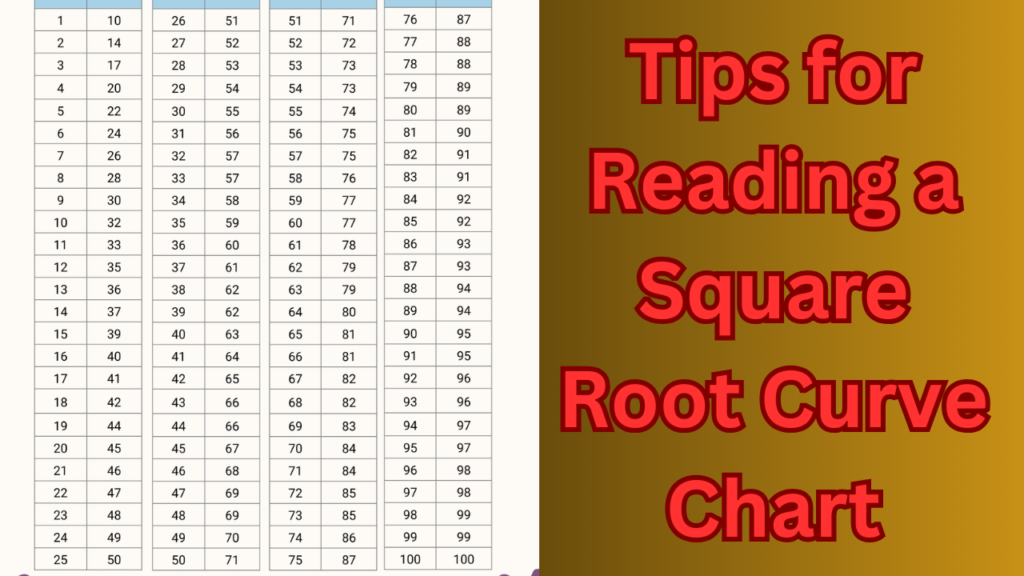
- Practice with different numbers: The more you practice, the better you will understand how the curve works.
- Use graph paper: If you are making your own square root curve, graph paper helps keep points accurate.
- Check with a calculator: If you are unsure, use a calculator to verify the square root values.
- Look for patterns: Notice that as numbers get larger, their square roots increase more slowly.
Also Check: What is Your Diamond Birthday?
FAQs
What is a square root curve chart used for?
A square root curve chart is used to show the relationship between two variables where one grows at a decreasing rate compared to the other. It is often used in physics, economics, and engineering to visualize patterns like diminishing returns or natural growth limits.
How do you identify key points on a square root curve chart?
To read the chart effectively, look for the starting point (usually at the origin), the general curve shape (which rises quickly and then levels off), and specific data points where values are plotted. Understanding the x-axis and y-axis labels is also crucial.
Why does a square root curve flatten out at higher values?
The curve flattens because, as the input value (x) increases, its square root (y) grows more slowly. This happens because the square root function follows a pattern where small input values have a greater impact, but as values get larger, the increase becomes less noticeable.
Conclusion
A square root curve chart is a useful tool for understanding how square roots work. By learning to read this chart, students can quickly find square root values and improve their math skills. Whether in school, science, or everyday life, knowing how to interpret this chart can be very helpful. Keep practicing, and soon you will be able to read square root curves with confidence!